
Blog Dashboard (Analytics)
Access your blog's analytics from the Dashboard to review visits, organic traffic, CTA clicks, top sources, top keywords, and per-post performance.
You can access your blog's analytics by clicking Dashboard from the left sidebar. This section provides a comprehensive overview of your blog's performance.
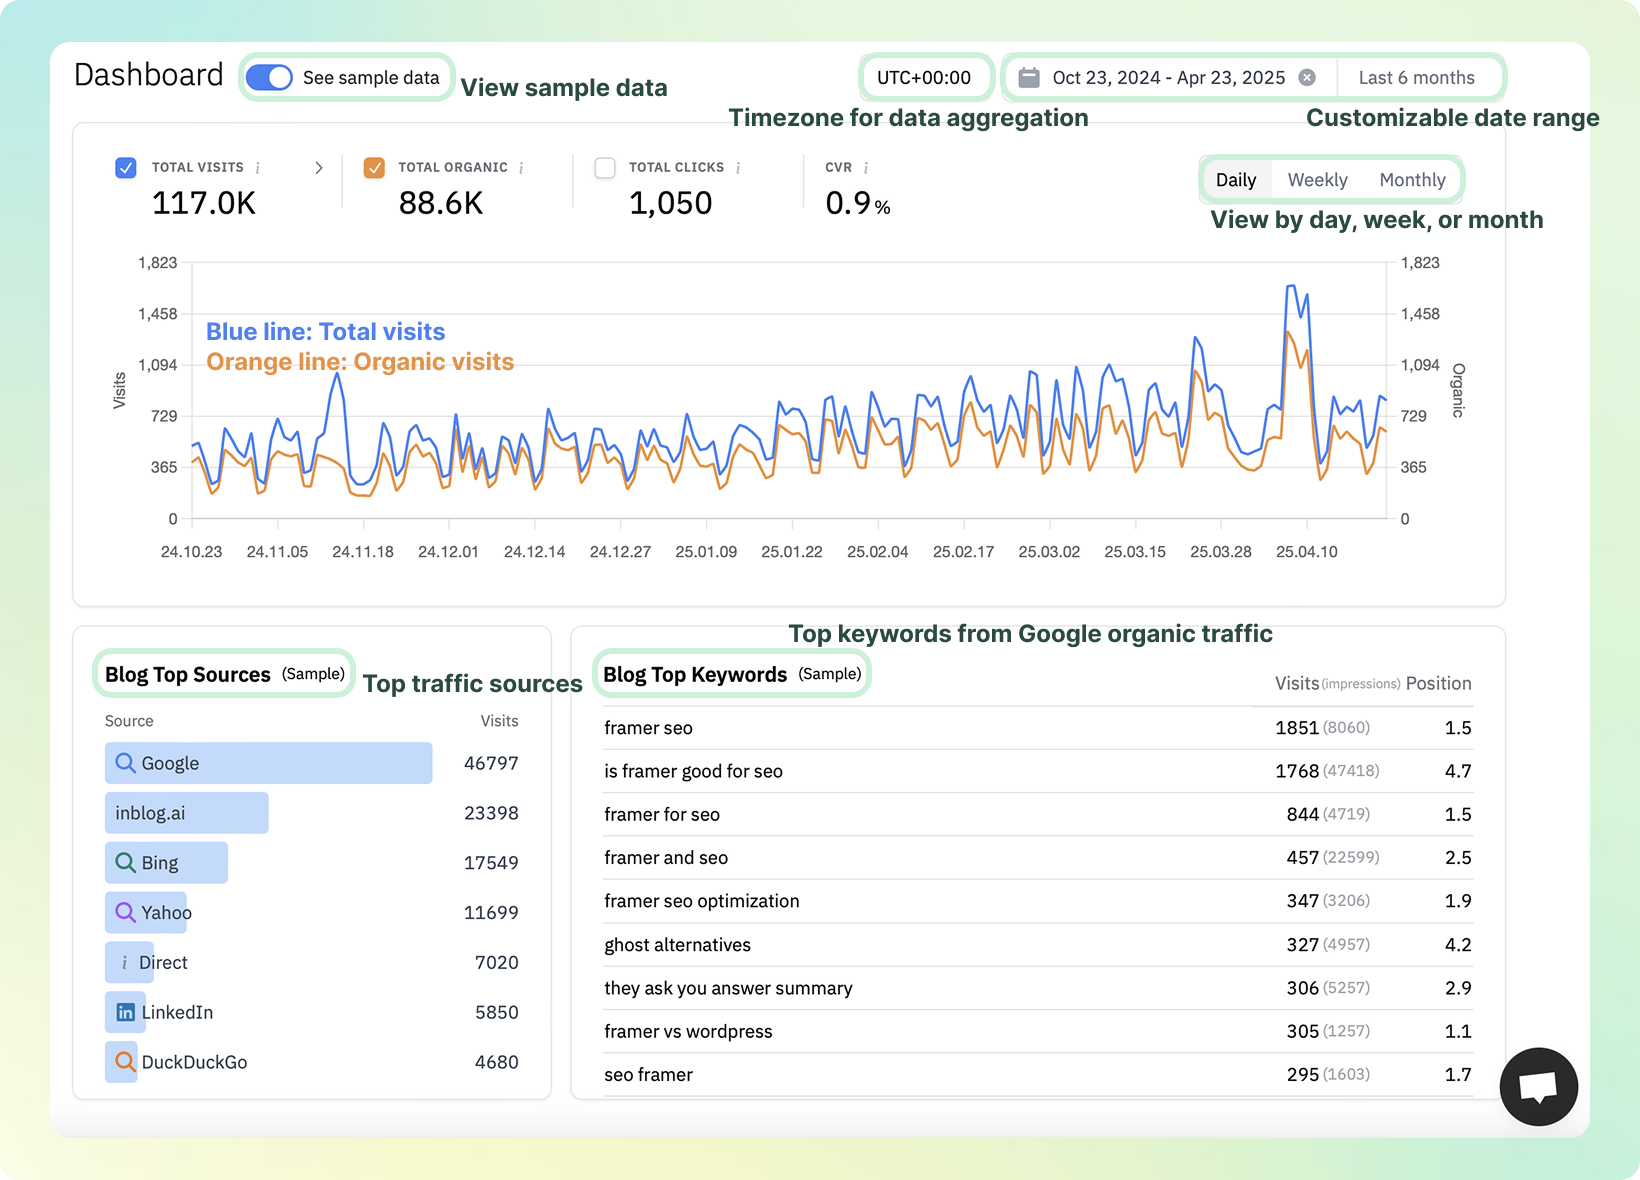
Key Features
- See Sample Data — Toggle sample data on/off from the top-left corner to explore how metrics are displayed.
- Timezone Configuration — Set the reference timezone for all aggregated data.
- Date Range Filter — Select the time range for which you'd like to view the data.
- Daily / Weekly / Monthly Views — Analyze performance metrics by day, week, or month.
Overview Metrics
- Total Visits — Total number of visitors to your blog.
- Total Organic — Number of visitors arriving through organic search (Google, ChatGPT, etc.).
- Total Clicks — Total number of CTA (Call-to-Action) button clicks across your blog.
- CTA Conversion Rate (CVR) — Calculated as: CTA Clicks ÷ Total Visits
- Top Sources — Traffic sources that drive the most visits to your blog (e.g., search engines, direct traffic, referrals).
- Top Keywords — Keywords that brought users to your blog via search engines.
- Visits: Number of sessions generated by each keyword
- Impressions: How many times your blog appeared for each keyword
- Position: Average Google ranking for the keyword
Google Analytics vs. the inblog Dashboard
The inblog dashboard shows inblog's own analytics — it does not pull data from Google Analytics. Connecting Google Analytics does not change the numbers shown here; GA data is viewed directly in analytics.google.com.
The "See Sample Data" toggle at the top of the dashboard shows example data for preview purposes. Turn it off to see your actual traffic. If your blog is brand-new, the dashboard may appear empty until real visitors arrive — this is expected.
Post-Level Analytics
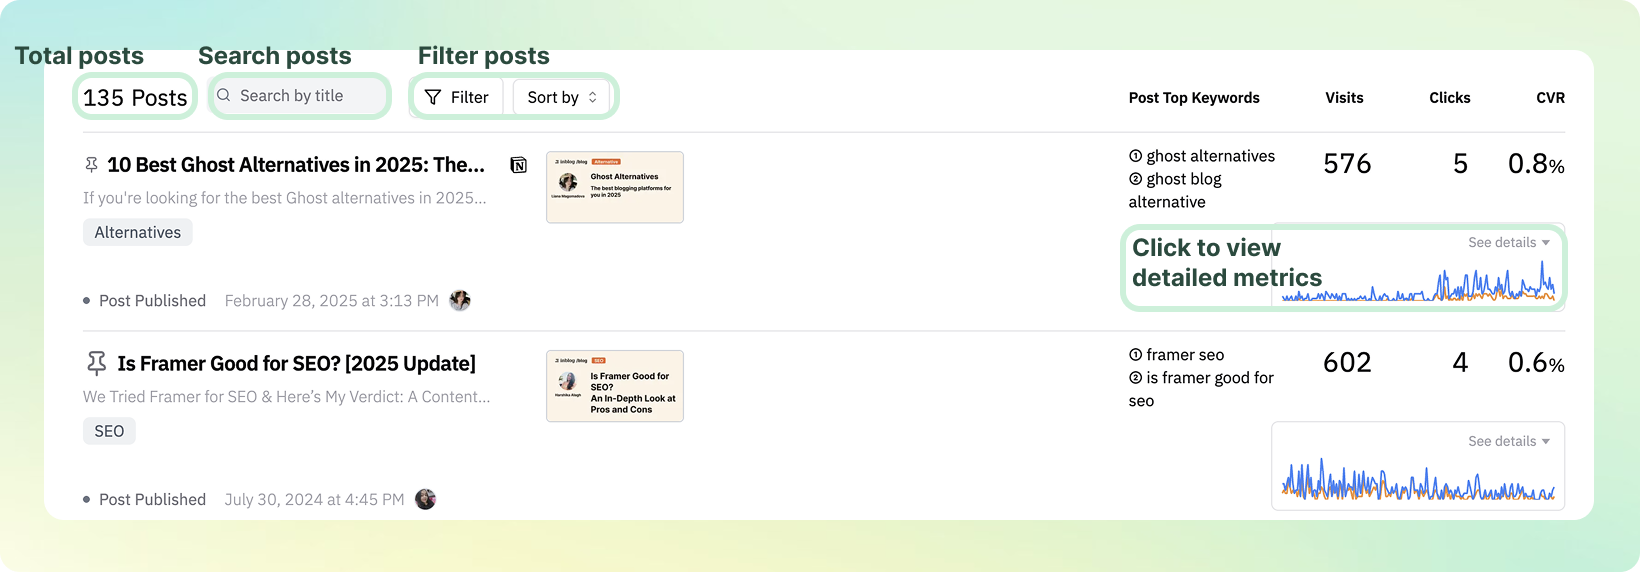
Scroll down to view individual post performance:
- Visits — Pageviews per post
- Clicks — CTA clicks per post
- CVR — Conversion rate per post
If your blog is connected to Google Search Console, you'll also see the keywords each post ranks for on Google.
Retrieve and export content performance with the API, Claude, or ChatGPT
On the Team plan or above, you can use the API or the Claude/ChatGPT integration to retrieve content performance for a chosen date range. The results can be turned into a CSV or Excel file by the tool you use. The API and MCP return data rather than a downloadable export file.
| Data | API | Claude/ChatGPT tool |
|---|---|---|
| Per-post visits, CTA clicks, organic traffic, and CTA conversion rate (CVR) | GET /api/v1/blogs/analytics/posts | list_post_performance |
| Post titles and publication dates | GET /api/v1/posts | list_posts |
| Blog-wide or per-post search keywords, search clicks, impressions, CTR, and average position | GET /api/v1/blogs/search-console/keywords | get_search_keywords |
CTA conversion rate (CVR) is CTA clicks ÷ visits. The API returns cvr as a ratio; multiply it by 100 to display a percentage. It is a different metric from Search Console search clicks and CTR.
Ask Claude or ChatGPT
Follow the inblog connection guide, then make a request like this. If you manage several blogs, name the blog you want to use. The connected account must have permission to view that blog's dashboard.
"Retrieve per-post visits, CTA clicks, CTA conversion rate, and organic traffic from the start of the blog through yesterday. Include titles and publication dates and format the results as CSV. Compare the results with the complete post list instead of returning only the top posts, and report missing rows or failed queries separately."
Check the date range, post coverage, and file contents
- Date range: Set
start_dateandend_dateinYYYY-MM-DDformat for performance queries. Without dates, the default is the last 28 days. For the full period, specify the blog's start date and the end date you want to include. - Titles and publication dates: To include titles in per-post performance, use
include=titlein the API orinclude_titles=truein MCP. Getpublished_atfrom the post list and join performance rows to posts usingpost_idandid. - All posts: The performance list returns 20 rows by default and at most 1,000. Set
limitand compare the results with the post list. Read every page of the post list; posts absent from the performance list can be checked using individual post performance queries. - Search keywords: A Search Console connection is required. Set
post_idonGET /api/v1/blogs/search-console/keywordsor MCP’sget_search_keywordsto retrieve top keywords for one post. Omit it for blog-wide keywords. Use theidfrom the post list; the post must belong to the selected blog. Setstart_date,end_date,limit,sort, andorderto control the date range, row count, and sorting. Search Console returns top rows, so results are not guaranteed to include every query. Results use the current public URL; performance from previous domains or slugs is not automatically combined.
To include per-post keywords, add a request such as:
"Call
get_search_keywordswith each post’s ID for the same date range. Format the top 10 keywords per post, search clicks, impressions, CTR, and average position as a separate CSV. Flag posts with no data or failed queries."
For a developer integration, see the API reference and API and MCP authentication guide.
Last updated 2026-09-30